
Rising Volumes, Rising Complexity: Two Decades of Structured-Note Prospectuses
Published:
This is an early, descriptive write-up of an ongoing project. The facts below are drawn from a text-parsed panel of SEC structured-note prospectuses; the interpretation is preliminary and the identification work is still in progress. Comments welcome.
What structured notes are, and why look at them
A structured note is a piece of senior unsecured bank debt with a derivative bolted on. Instead of paying a fixed coupon, the note pays off according to a formula written on some underlier — the return on the S&P 500, the worst performer among three stocks, whether an index stays inside a range, and so on. The buyer is, in effect, lending money to the bank and simultaneously buying (or selling) a package of options that the bank writes into the terms.
These instruments are sold overwhelmingly through retail and wealth-management channels, in denominations as small as $1,000, to investors reaching for yield or for “protected” equity exposure they can’t easily assemble themselves. That combination — genuine complexity, a captive and largely inattentive buyer base, and an embedded fee that no single number on the cover page fully reveals — is what makes the market interesting from a disclosure and market-structure standpoint.
The nice thing about studying them in the U.S. is that every single note is a public document. Banks register structured notes on EDGAR as SEC Form 424B prospectuses (mostly 424B2), one filing per deal, each spelling out the payoff, the underliers, the fees, and pages of risk factors. That is an enormous, machine-readable archive of exactly how a bank chose to manufacture and describe a product for retail. This project reads that archive at scale.
The data
I assemble structured-note prospectuses filed on EDGAR by the major dealer banks — JPMorgan, Citi, Morgan Stanley, Goldman Sachs, Bank of America, Wells Fargo, Barclays, and UBS — spanning roughly 2004–2025. From each filing I parse the payoff structure, the underliers, the number of payoff features and hypothetical scenarios, standard readability measures on the prospectus text, the disclosed fees, and, where the cover page permits, the deal’s notional size. The result is a deal-level panel of tens of thousands of notes with both what the product is and how it was described.
Three facts jump out. Issuance has boomed; the products have grown more complex; and the embedded cost has stayed high and shifted in composition. I take them in turn.
Fact 1: Issuance has boomed
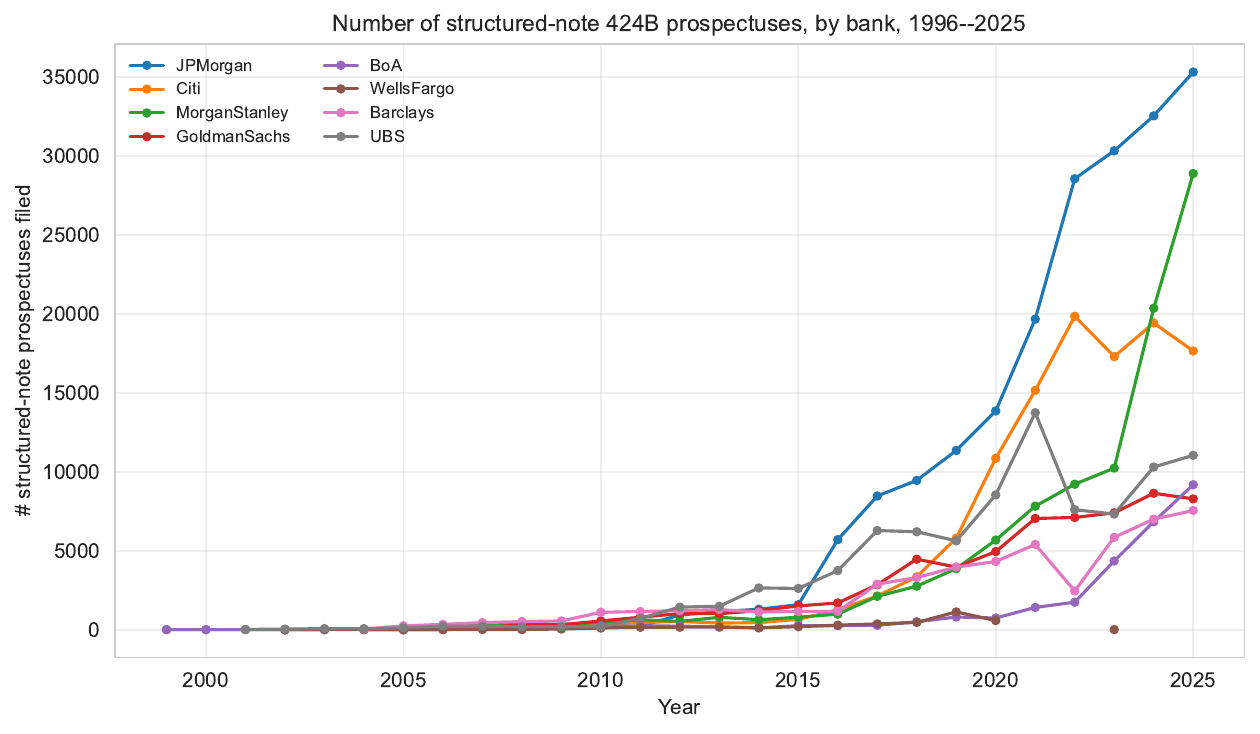
The most basic pattern is sheer growth. The number of structured-note prospectuses filed each year by these banks has risen from a trickle in the mid-2000s to tens of thousands per year, led by JPMorgan and, more recently, a sharp acceleration at Morgan Stanley and Citi.
Counts can be inflated by ever-finer slicing of otherwise similar deals, so the volume picture matters more. Measuring the notional we can parse directly off the cover pages, total issuance across these banks climbs from roughly $20 billion a year in the mid-2010s to well over $130 billion by the mid-2020s — a more-than-sixfold increase, with the steepest leg during and after the 2022–23 rate-hiking cycle, when higher rates made it cheaper for banks to package attractive-looking headline coupons.
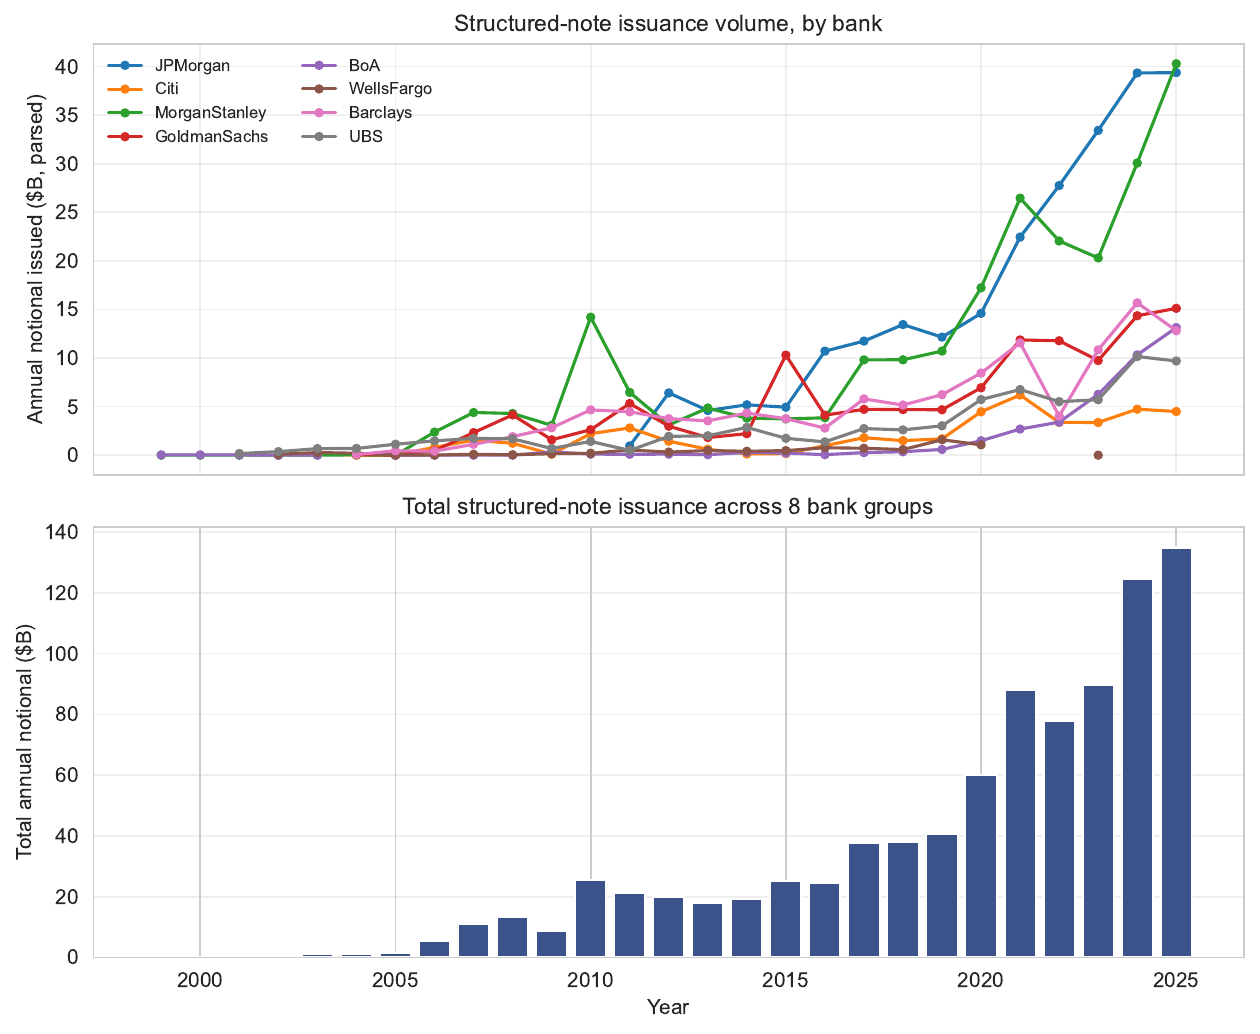
(These parsed figures are a lower bound on the true market — they count only deals where the cover-page total is cleanly machine-readable — but the trend is unambiguous.) The market is also concentrated: a handful of dealer banks with the derivatives infrastructure to hedge these payoffs account for essentially all of it, while balance-sheet giants like Bank of America and Wells Fargo remain minor issuers of these registered retail prospectuses.
A balance-sheet cross-check. The prospectus panel measures the flow of public 424B2 deals; the same banks’ 10-K balance sheets tell the same story from the stock side. The long-term debt these dealers carry at fair value — which the filings note is predominantly structured notes — rose at every major issuer between year-end 2022 and year-end 2023: Citigroup to $116B (+10%), Morgan Stanley to $94B (+19%), JPMorgan to $88B (+22%), and Goldman Sachs to $86B (+18%). Two wrinkles sharpen rather than blur the picture. Bank of America and Wells Fargo — minor issuers in the registered-prospectus panel — nonetheless carry roughly $43B and $9B of structured debt on their balance sheets, a reminder that “minor issuer” describes the retail prospectus flow this project parses, not the banks’ total structured-debt footprint. And UBS’s balance-sheet figure jumps on the Credit Suisse acquisition rather than organic issuance. The direction is otherwise uniform: the outstanding stock is growing in step with the prospectus flow.
Fact 2: The terms are getting more complex
Growth alone would be unremarkable — lots of markets grow. The more striking pattern is that the product itself has become more complicated over the same period, along several independent axes.
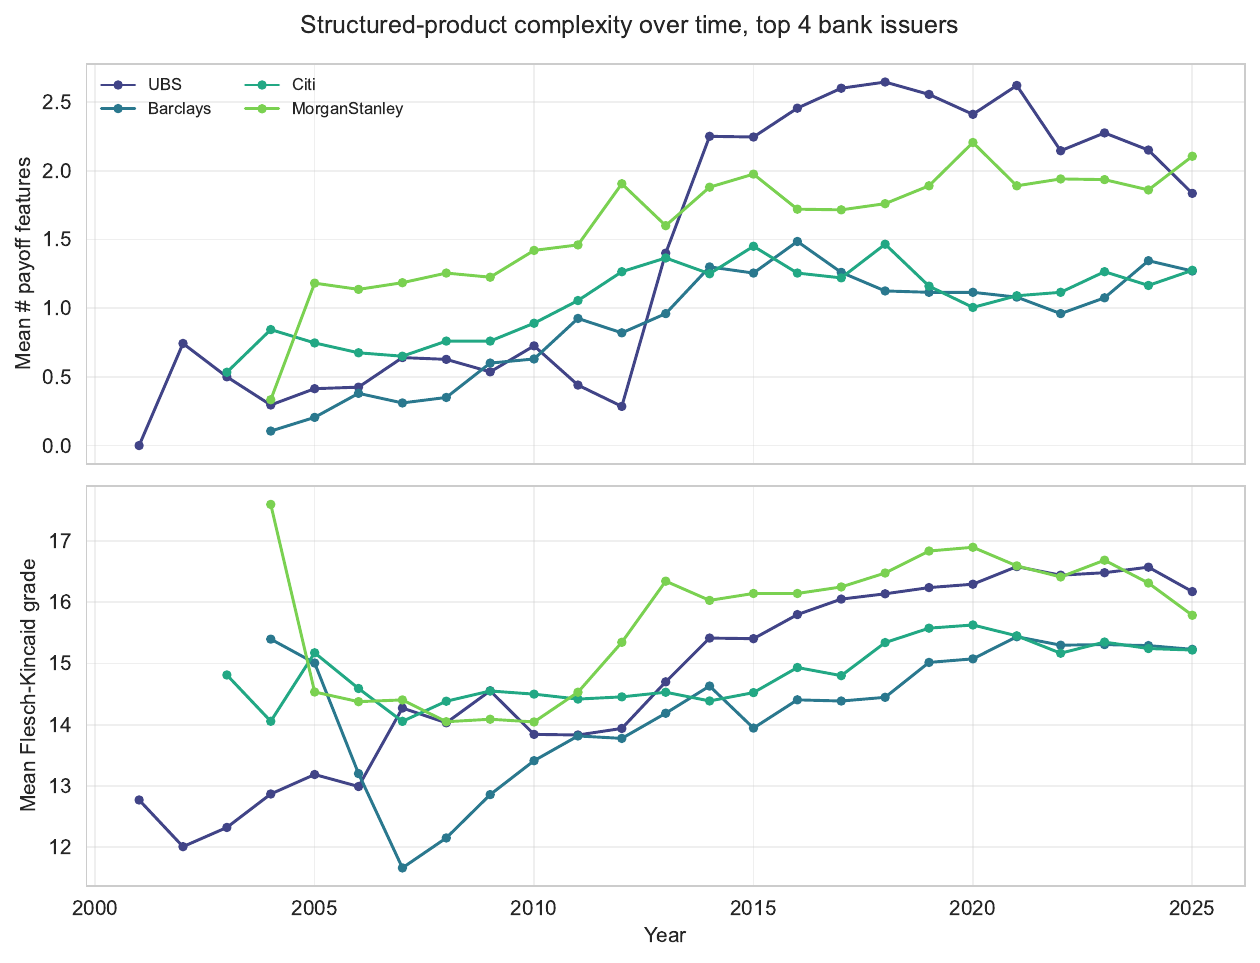
More moving parts. The average note carries more distinct payoff features — buffers, barriers, caps, autocall triggers, memory coupons, step-downs — than it did fifteen years ago. For the top issuers the mean number of payoff features roughly doubles over the sample.
Harder to read. The prospectus text itself gets less readable. Mean Flesch–Kincaid grade level on these documents drifts up into the 16–17 range — i.e., past a college reading level — for the largest issuers, even as the products are marketed to ordinary retail buyers.
More underliers, and worse ones. Perhaps the cleanest sign of rising structural complexity is the rise of the “worst-of” basket. In a worst-of note the investor’s payoff tracks whichever underlier does worst — a structure that is short correlation and considerably riskier than a single-underlier note with the same headline coupon. The average basket size climbs from about 1.1 underliers to over 2.1, and the share of notes written on multiple underliers rises from roughly 12% to nearly 50% over the sample.
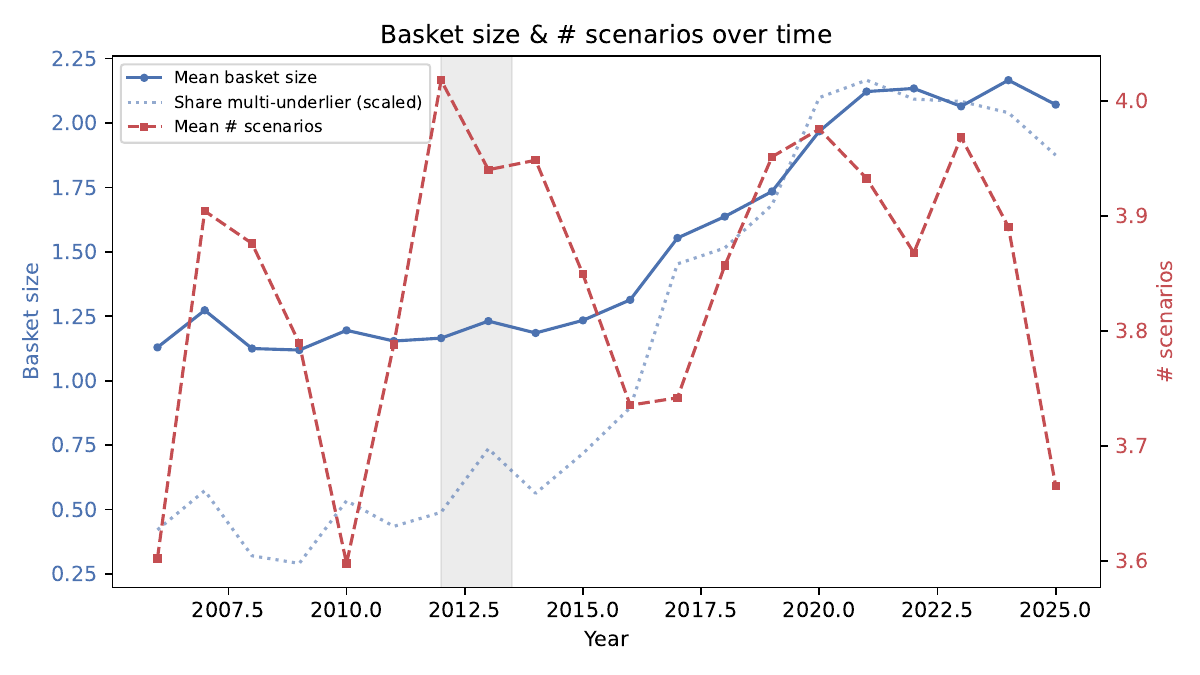
The important thing about the worst-of boom is that it is not summarized by any single number a retail buyer is likely to look at. A worst-of-three note at a 4% coupon is meaningfully worse than a single-underlier note at 4%, but the coupon on the cover page is identical. Complexity of this kind moves risk into terms that resist one-line summary.
Fact 3: The embedded cost, and where it sits
Since 2012, following an SEC disclosure sweep, issuers have had to print an estimated value for each note — effectively an admission of the embedded fee, the gap between what the buyer pays (par) and the bank’s own model value of what they receive. Parsing this disclosed value across the panel (available from 2013, with ~93% coverage) gives the first market-wide series of structured-note fees with issuer identity and deal-level design attached. The median disclosed embedded fee is about 4.1 percentage points of principal — a substantial one-time cost on a product often held to maturity.
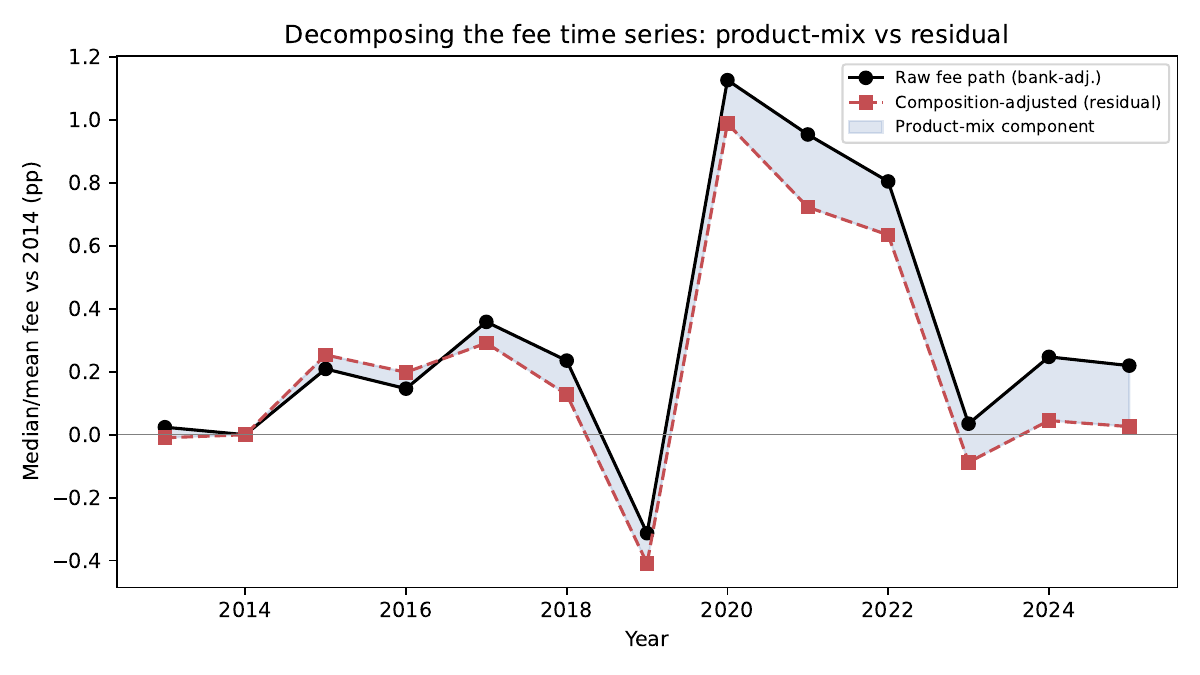
Decomposing a representative total load of ~4.4 points, roughly 1.5 points is disclosed sales commission to the distributor and the remaining ~2.7 points is residual — the issuer’s structuring-and-hedging take. And when the fee series is decomposed into what the bank manufactures (product mix) versus macro conditions, the product-mix component persists even after the macro component reverses — consistent with a structural shift in what is being sold, not just a transient response to the rate environment.
Why might this be happening?
Three forces plausibly push in the same direction, and disentangling them is the harder part of the project.
- Demand for yield and packaged exposure. In low-rate years, and after regulatory changes pushed some advisors out of high-commission brokerage models, banks manufactured ever-more-elaborate ways to sell a headline coupon. This is the U.S. analogue to Célérier and Vallée’s finding (in Europe) that complexity rises with retail demand and tracks embedded fees.
- Re-shrouding. Once the SEC forced the single embedded-value number into the open, the natural response — familiar from the shrouded-attributes literature — is to relocate rent into terms that one number can’t capture. The worst-of boom is a leading candidate: it raises the effective cost while leaving the disclosed coupon and even the disclosed fee looking ordinary.
- Bank funding. For some dealers — Morgan Stanley most of all — structured notes have grown into a genuine funding instrument, a large share of long-term debt, which gives banks a balance-sheet reason to keep the machine running.
The live policy question sits on top of all this. A string of distribution-side rules — the DOL fiduciary rule, Reg BI, FINRA Notice 22-08 on complex products — raised the bar for selling complicated products to retail. Whether mandated transparency actually disciplines what issuers charge and manufacture, or simply gets routed around, is exactly what the richer parts of this project try to test.
What this is, and isn’t
Two honest caveats. First, this is supply-side evidence: I observe what banks issue and how they describe it, not who buys it or how those buyers ultimately fare. Statements about investor welfare would require secondary-market or trade-level data (e.g., TRACE) that this panel does not contain. Second, the disclosed estimated value is the issuer’s own model output — useful and now mandatory, but not an independent fair value, so the fee series is best read as what the disclosure makes salient rather than ground truth.
With those caveats, the descriptive picture is clear and, I think, underappreciated: a large and fast-growing market, sold mostly to retail, in which the products have been getting steadily more complex — and in which a good deal of the complexity lands precisely where a single disclosed number cannot follow it.